Stage 01
Collect
Aggregate telemetry from enterprise environments into one monitored data plane.
- IT, cloud, and application signals
- Database, network, and security telemetry
- IoT, OT, and SCADA visibility inputs
Unified Monitoring & Managed Operations
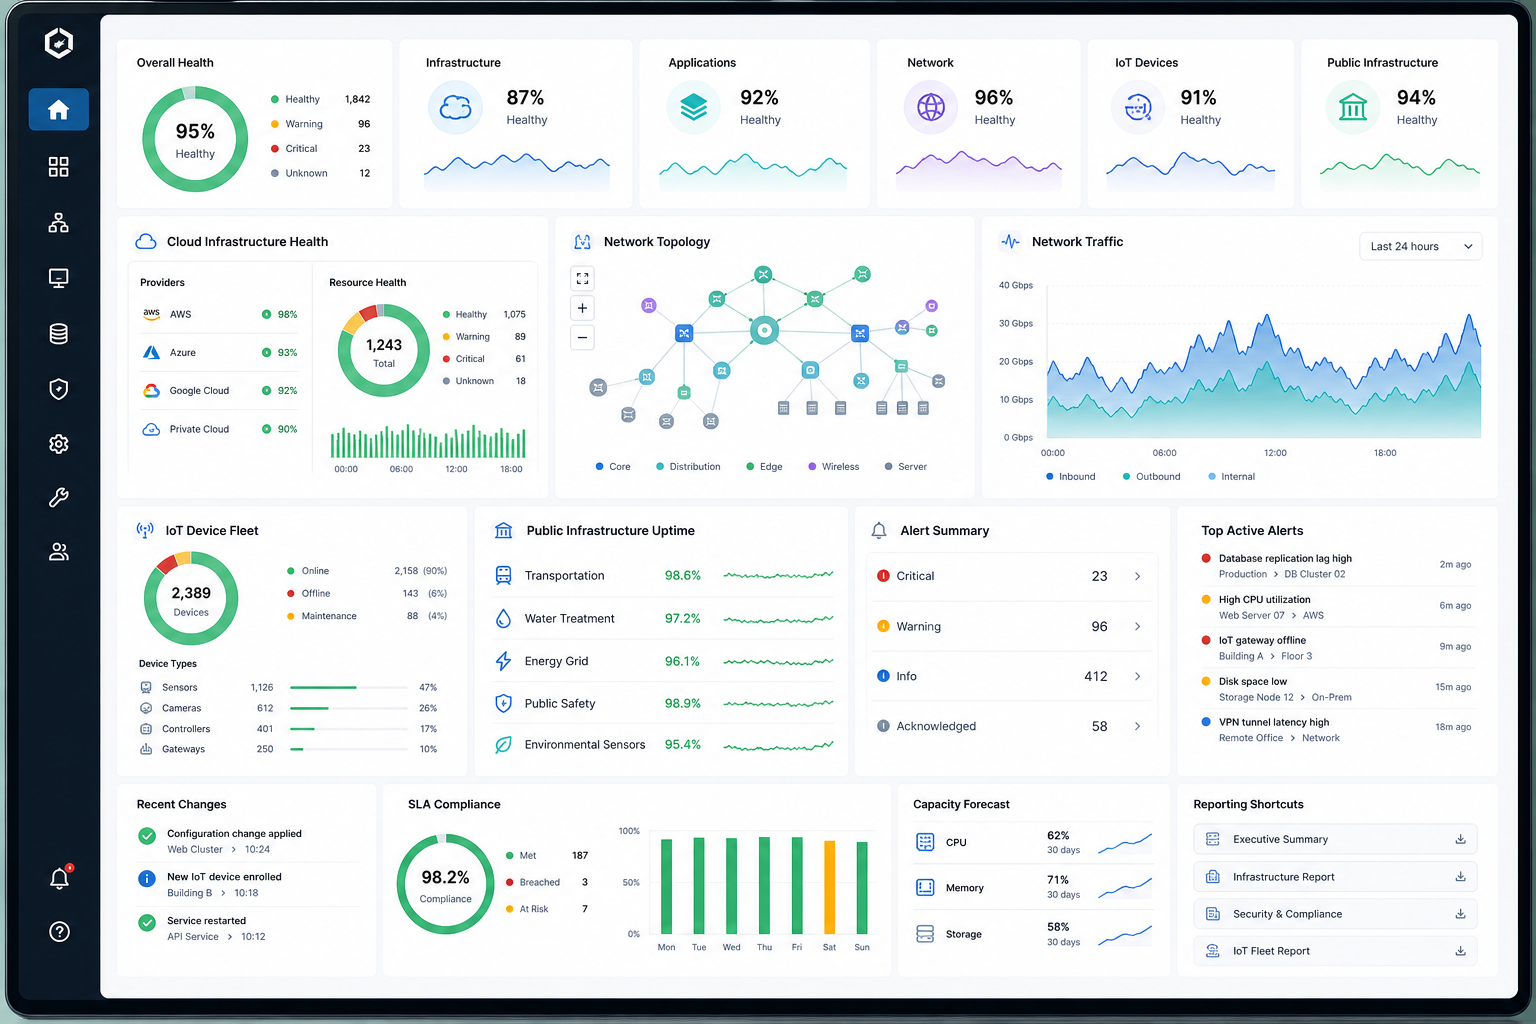
NexSightS unifies observability, AIOps, and managed operations so enterprise teams can coordinate faster decisions across digital and physical environments without losing governance.
Unified Monitoring SYSTEM
Live Topology & Telemetry


Operational environments we support
Built for organizations that run critical services across complex digital and physical estates.
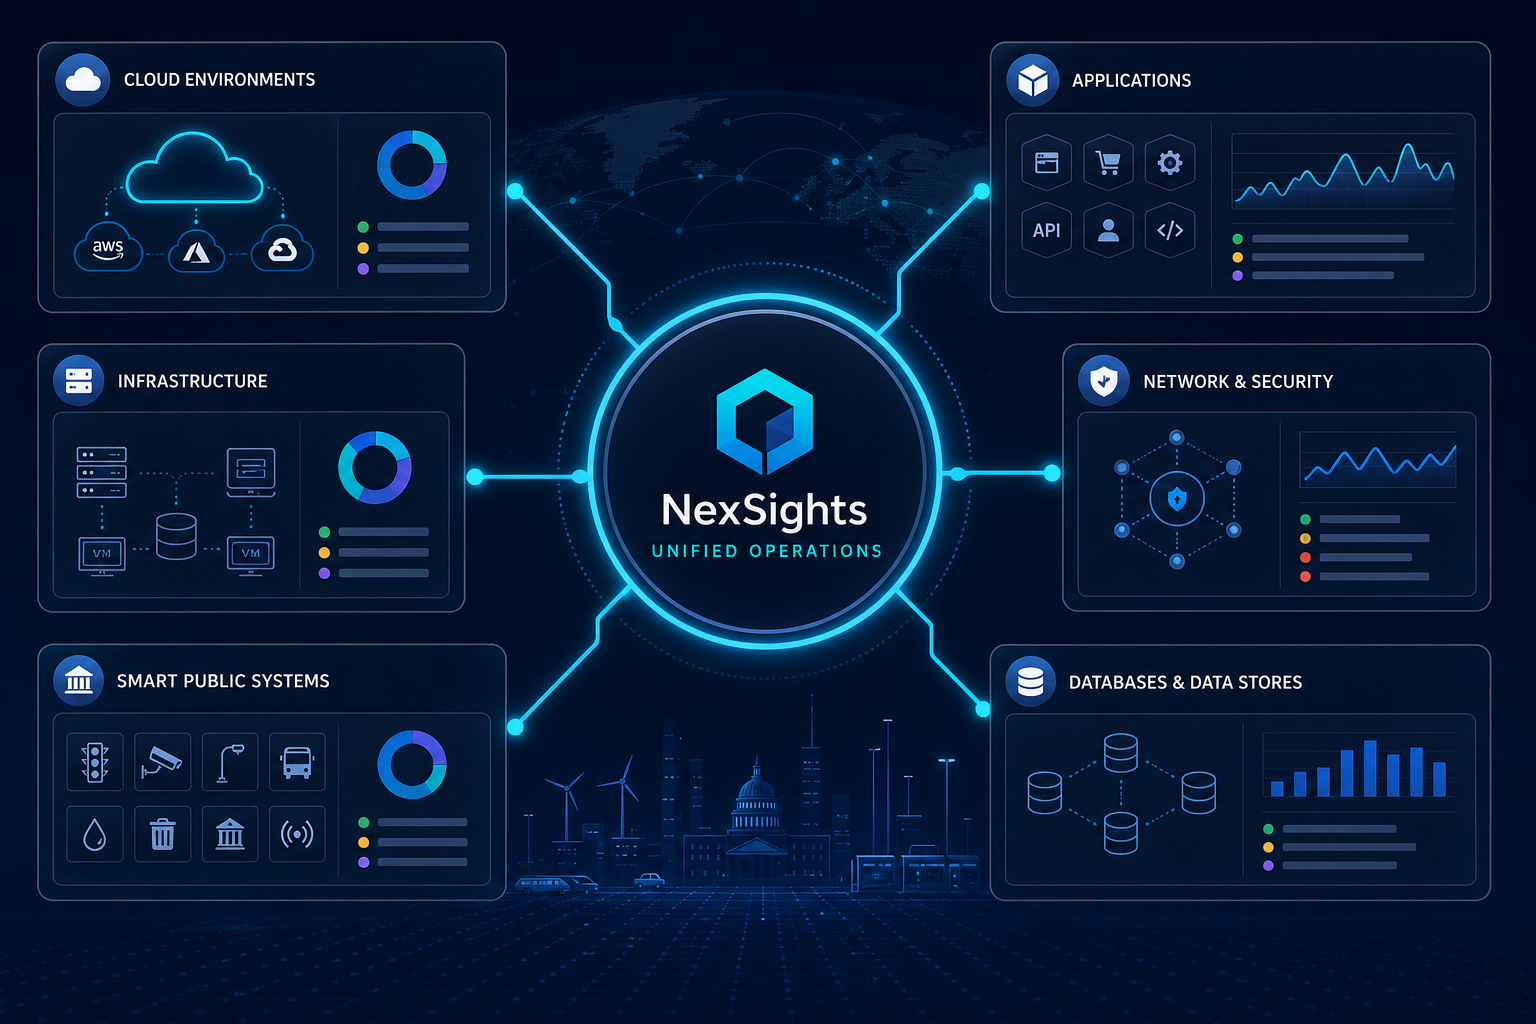
Unified coverage domains
NexSightS brings cross-domain monitoring into a single operational layer so teams can see dependencies, prioritize risk, and respond with confidence.
Track servers, virtualization, storage, and facility-linked dependencies in one governed operational plane.
Expose service health, spend-sensitive telemetry, and workload behavior across hybrid cloud estates.
Reveal transaction paths, service latency, and user-impacting bottlenecks across critical apps.
Surface query pressure, replication integrity, and performance drift before service degradation spreads.
Map path health, link saturation, and edge reliability across campus, WAN, and remote sites.
Correlate security telemetry with operations context to prioritize incidents by business impact.
Monitor distributed sensors, civic infrastructure, and edge device states across large estates.
Provide OT-safe visibility for controllers, process assets, and plant-level operating conditions.
Operating Model
NexSightS applies a four-stage method that turns signals across digital and physical systems into trustworthy operational decisions.
Stage 01
Aggregate telemetry from enterprise environments into one monitored data plane.
Stage 02
Apply security and control guardrails before operational decisions are made.
Stage 03
Turn normalized signals into shared operational understanding and trends.
Stage 04
Coordinate response with approved controls and operational accountability.
Service Portfolio
NexSightS delivers a unified service model across IT, cloud, security, IoT, OT, and public infrastructure so enterprise teams can move from fragmented tooling to one governed operational view.
Baseline current-state monitoring, risk, and target operating outcomes before platform decisions.
Instrument hybrid infrastructure and cloud estates with policy-aligned performance visibility.
Correlate user-impacting application behavior with database latency, errors, and capacity trends.
Unify network health and security telemetry to shorten detection and escalation cycles.
Apply event correlation and context enrichment to accelerate probable cause identification.
Extend monitoring to distributed sensors and civic platforms with operational governance controls.
Deliver OT-safe visibility patterns that respect plant constraints, safety, and change windows.
Connect telemetry, ticketing, CMDB, and workflows for repeatable, auditable response orchestration.
Provide governed day-two monitoring operations, reporting cadence, and continuous optimization.
Governance Principles
Seven controls that keep enterprise monitoring governed, auditable, and OT-safe.
Role-scoped access by default.
Protected in transit and at rest.
Tenant and network boundaries enforced.
Every operator action is traceable.
OT visibility without control-path writes.
Changes follow governed workflows.
Critical actions require sign-off.
Client confidence
Measured outcomes from complex environments where unified monitoring must support IT, operations, and public-service reliability.
Infrastructure Lead
“We finally have one operational view across cloud, network, and plant systems. Escalations are cleaner because teams are looking at the same signal set.”
Operations Manager
“Alert noise dropped once dependencies were mapped. We now roll changes with better confidence because service impact is visible before it becomes an outage.”
Public Systems Director
“Operational oversight is stronger now. Governance reporting is clearer, and our teams can evidence service continuity decisions across distributed public infrastructure.”
Engagement Process
A practical land-and-expand path for enterprise teams that need validated outcomes before scaling into managed operations.
Step 1
Define business priorities, monitoring gaps, and governed scope.
Step 2
Validate priority use cases with measurable technical and operational outcomes.
Step 3
Deploy in controlled waves with governance, integration, and adoption checkpoints.
Step 4
Run continuous monitoring operations with executive visibility and ongoing improvement.
Prefer to start with measurable validation? Begin with a scoped proof of concept and expand once outcomes are confirmed.
Plan a Proof of ConceptService tiers
Each plan aligns to enterprise monitoring maturity — from foundational visibility to governed operations across critical and regulated environments. Commercial terms are tailored in a proposal after discovery.
Structured baseline monitoring for teams consolidating fragmented tools and alerts.
Expanded observability and automation for multi-team, multi-environment operations.
Governed, OT-safe operations model for critical infrastructure and regulated organizations.
Buyer FAQ
Short, practical guidance for enterprise stakeholders evaluating unified monitoring across IT and operational environments.
Most clients begin with a discovery and assessment workshop to define service priorities, data sources, governance needs, and phased rollout scope before any implementation commitment.
Yes. OT and SCADA visibility is designed around read-only collection patterns, segmented access, and change-control alignment so monitoring supports operations without introducing control risk.
We map current systems first, then integrate in waves using governed connectors, normalized telemetry, and validation checkpoints to avoid disruption to production workflows.
Coverage can include platform administration, alert tuning, health checks, dashboard stewardship, reporting cadences, and joint incident review aligned to your operating model.
Scoping is evidence-based: environment complexity, integration depth, governance requirements, and phased milestones are documented so stakeholders can review options clearly.
Yes. We align delivery to policy controls, audit expectations, and segmentation standards common in regulated enterprises and public systems, with traceable governance throughout.
Need a precise rollout path for your environment? We can align technical, operational, and governance stakeholders in one planning track.
Schedule a Monitoring Discovery SessionBring your architecture, constraints, and priorities to one focused conversation with NexSightS.
Which critical service, site or operational risk should we make visible first?